Windows 11 vs Ubuntu vs Fedora vs Arch Linux - Speed Test!

This article is a work in progress at the moment. More links to results and data will be ready soon.
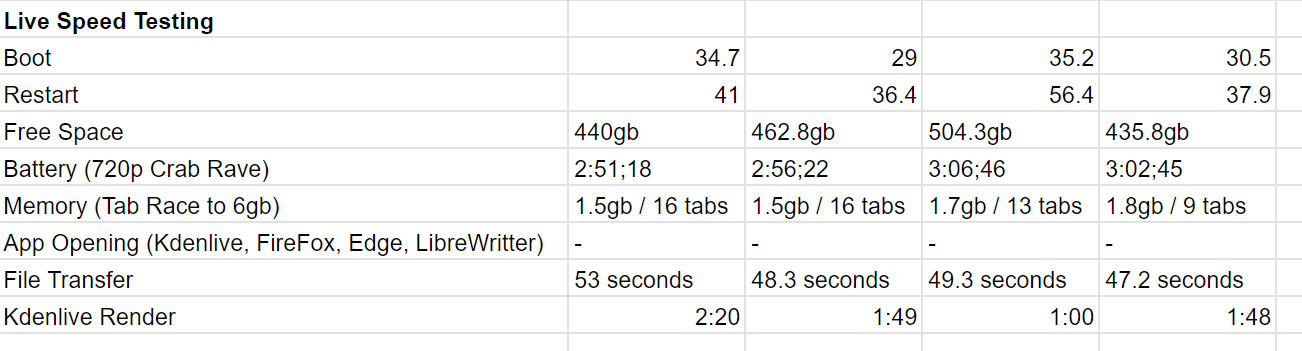
Hardware Information
Intel N95 Laptop. AX15 with 16GB DDR4. 512GB M.2 SSD.
Software Information
Ubuntu 22.04.3 LTS; Kernel 6.5.0-14-generic, GNOME 42.9, Firefox 121.0.1 (snap), Edge 120.0.2210.133 (flatpak)
Fedora 39; Kernel 6.6.14-200.fc39, GNOME 45.3, Firefox 122.0 (dnf), Edge 120.0.2210.133 (flatpak)
Arch (EndeavourOS); Kernel 6.7.0-arch3-1, KDE Plasma 5.27.10, Firefox 121.0.1 (arch), Edge 120.0.2210.133 (flatpak)
Windows 11 HOME; Version 2H22, OS BUILD 22621.3155, Edge 121.0.2277.128, Firefox 122.0
Windows 11 vs Ubuntu vs Fedora vs Arch Linux
In this full video I cover all the results and give my final thoughts.
Raw results video below was published early to paid newsletter members! Consider joining to support our work directly.
Synthetic Benchmarking
Now for some synthetic benchmarks Some of these prettier graphs I made with Graphy were due to errors with Open Benchmark not properly displaying/saving some of my results.
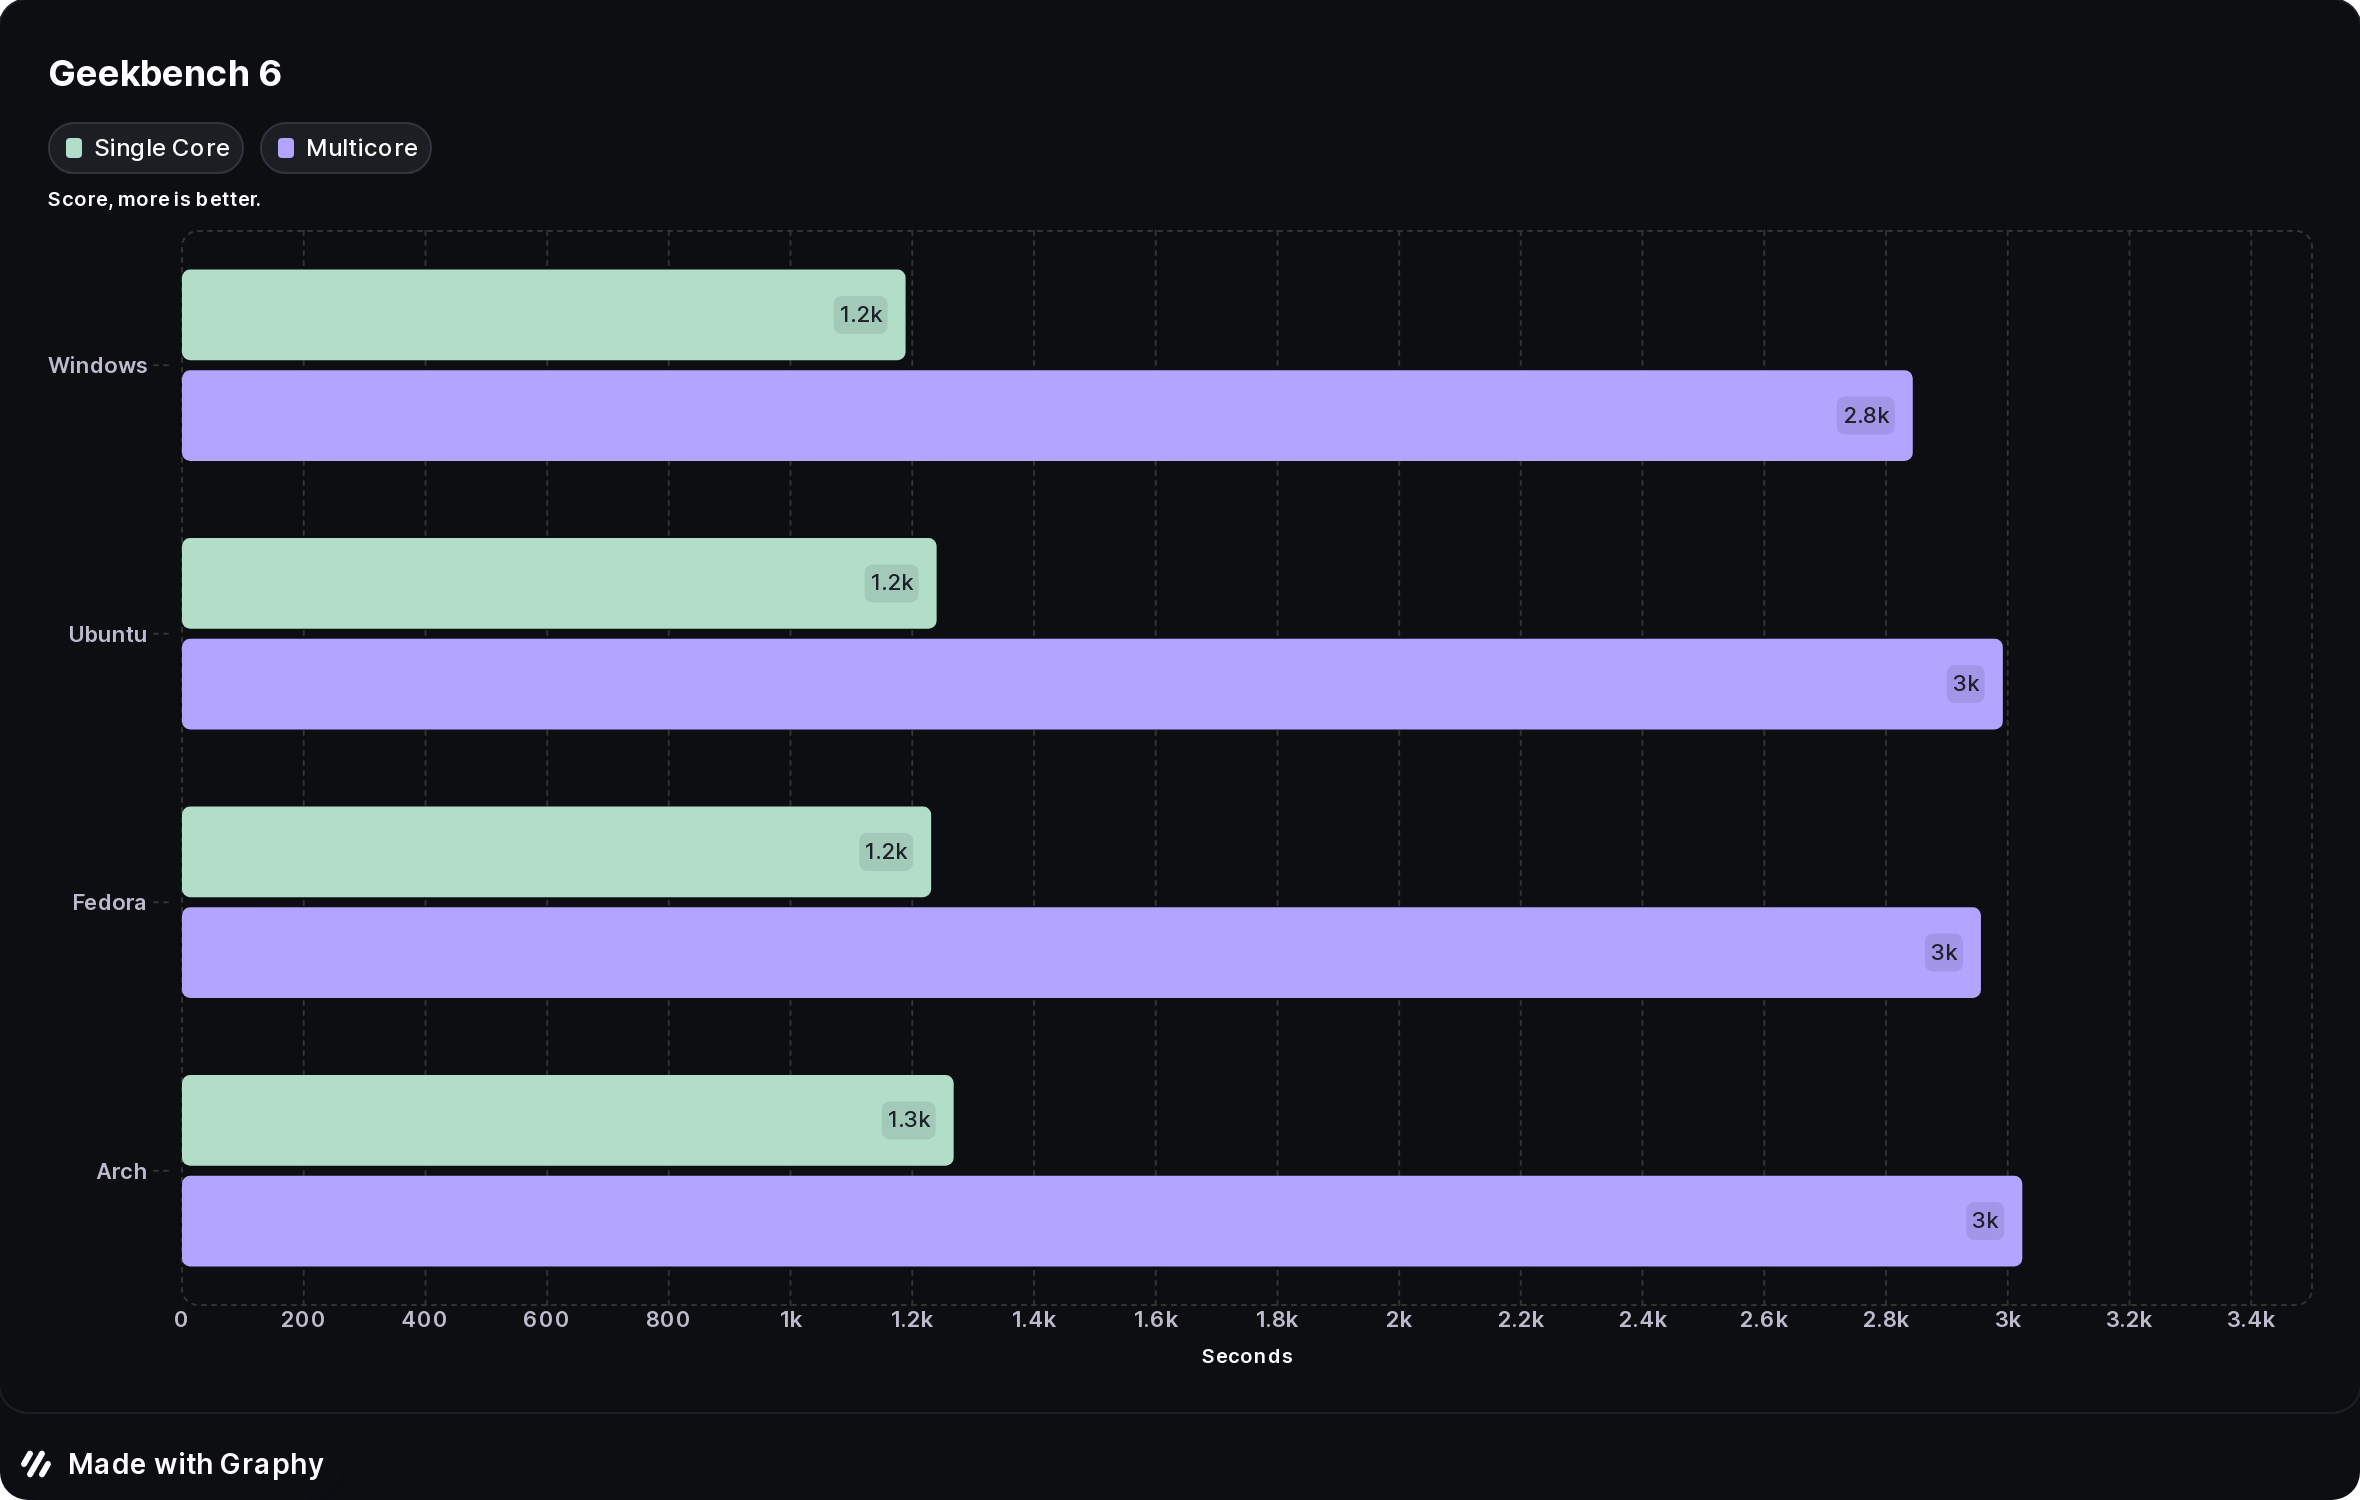
Geekbench 6 is a cross-platform benchmark that measures a system's overall performance. See the full results here: https://browser.geekbench.com/user/344897
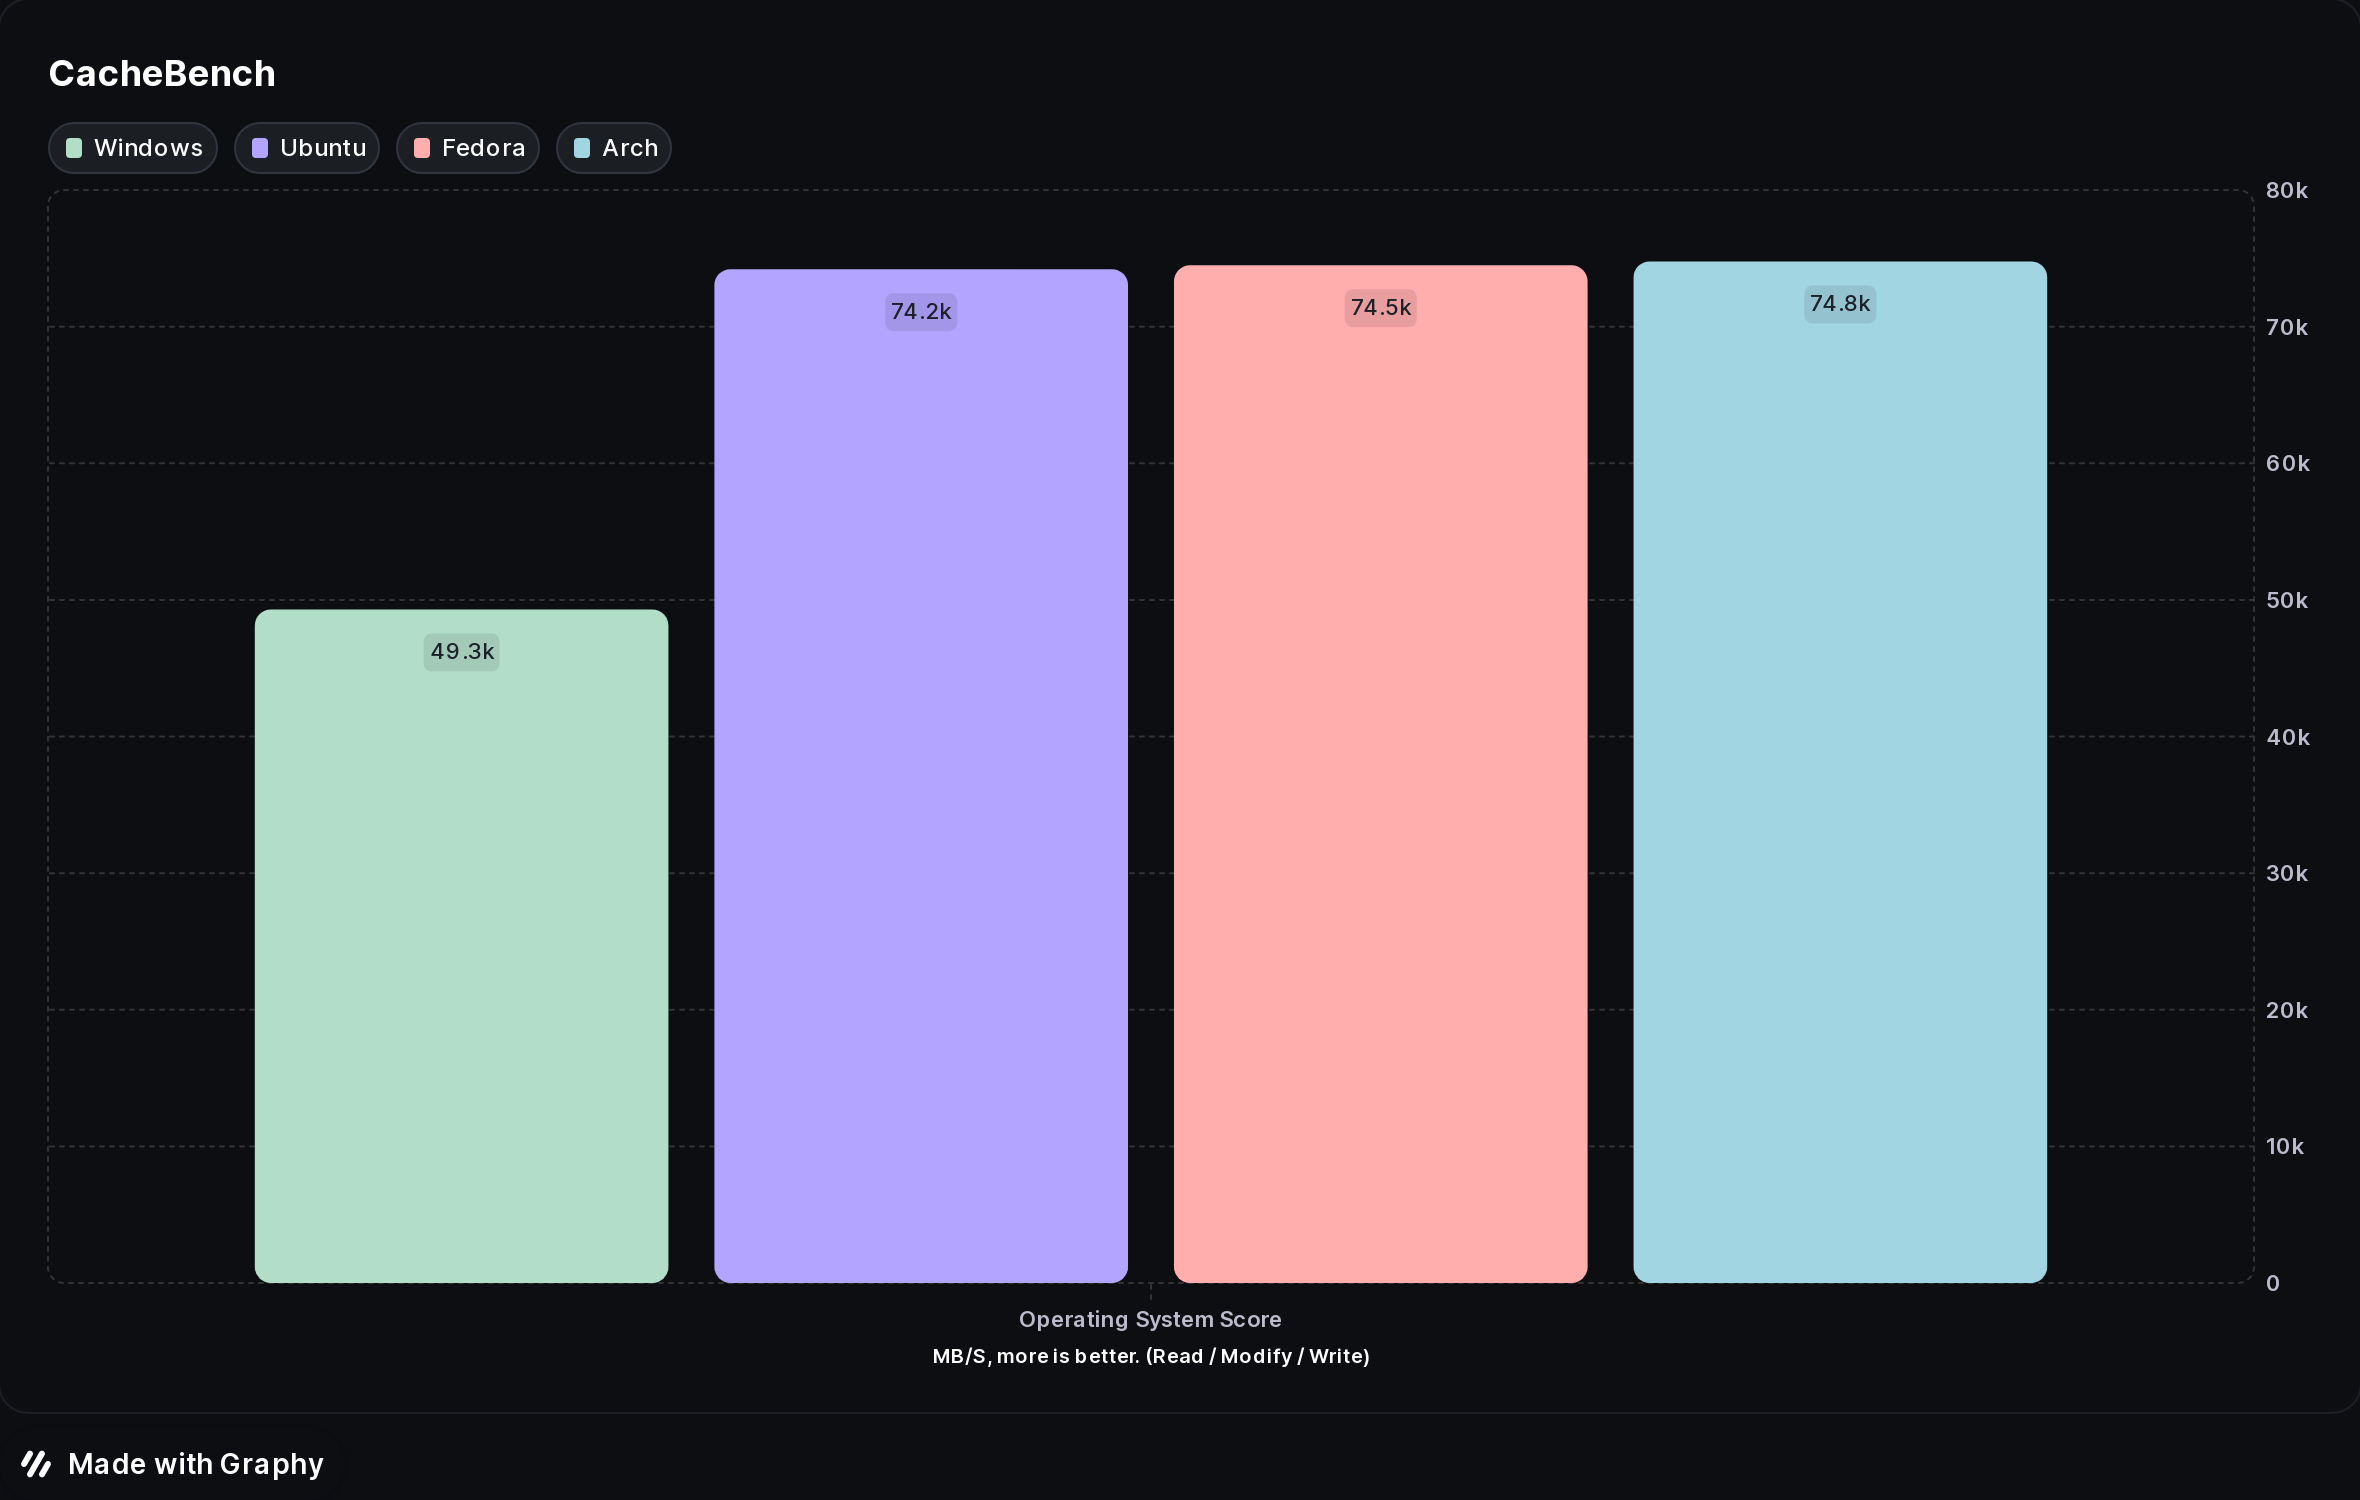
CacheBench is designed to test the memory and cache bandwidth performance.
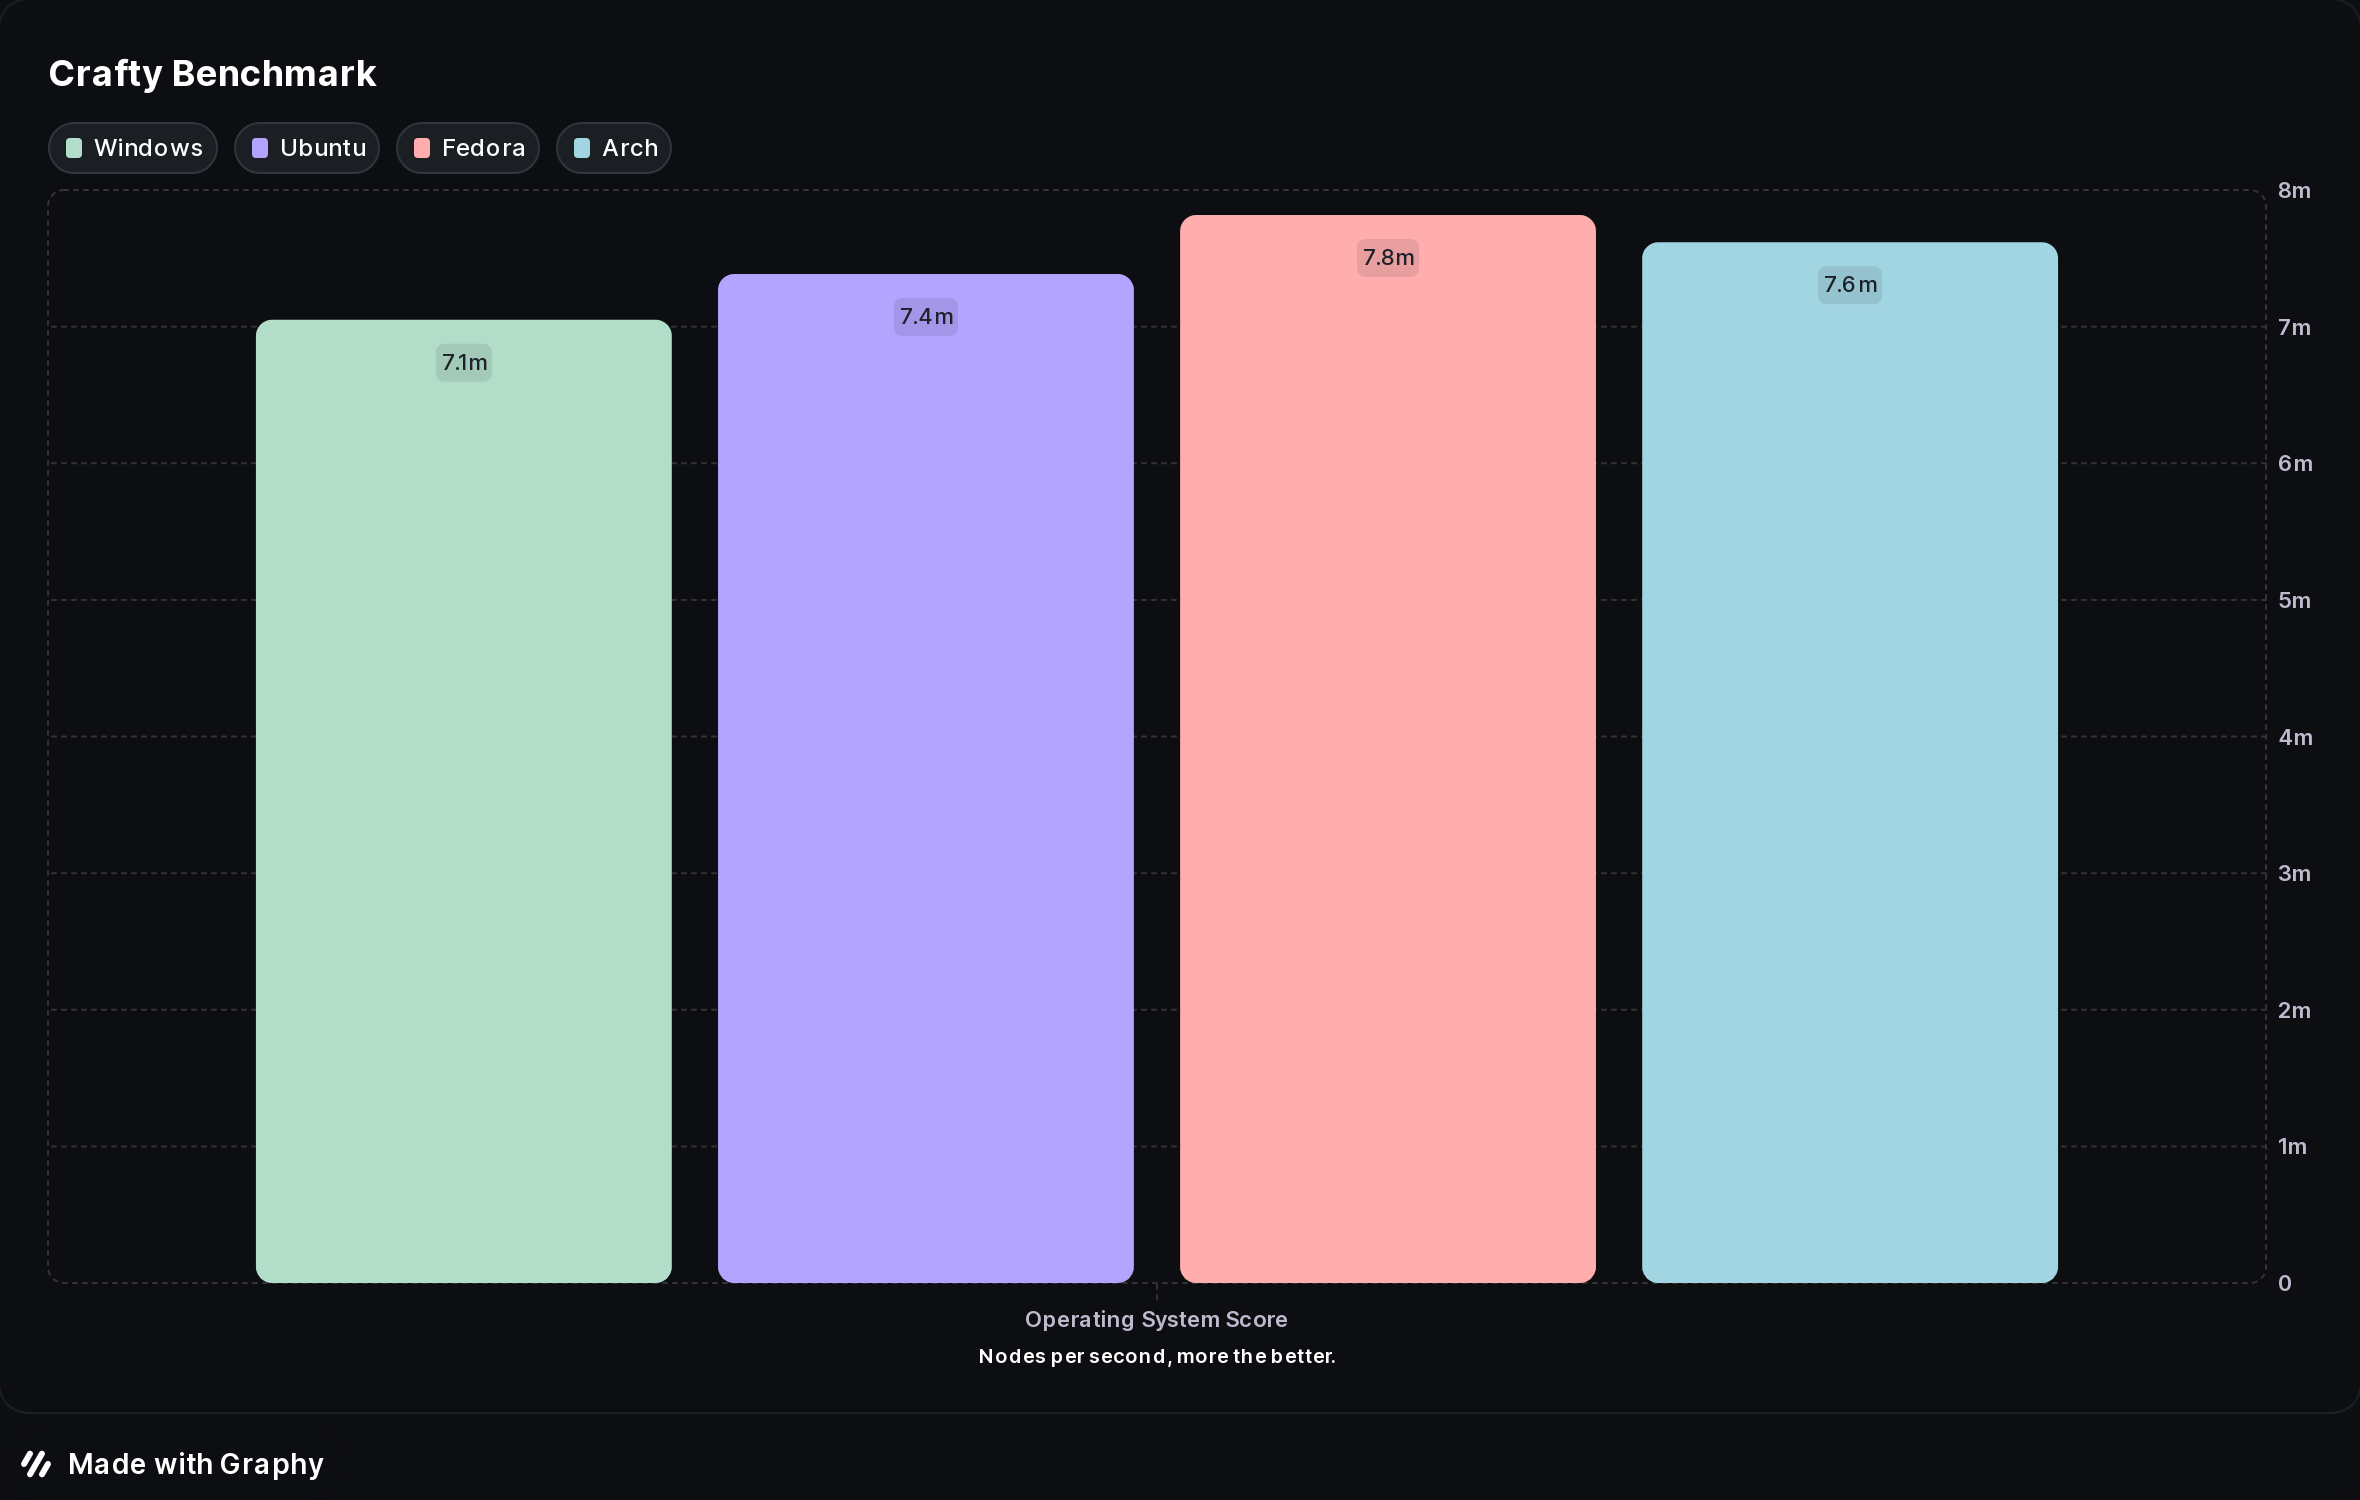
This is a performance test of Crafty, an advanced open-source chess engine.
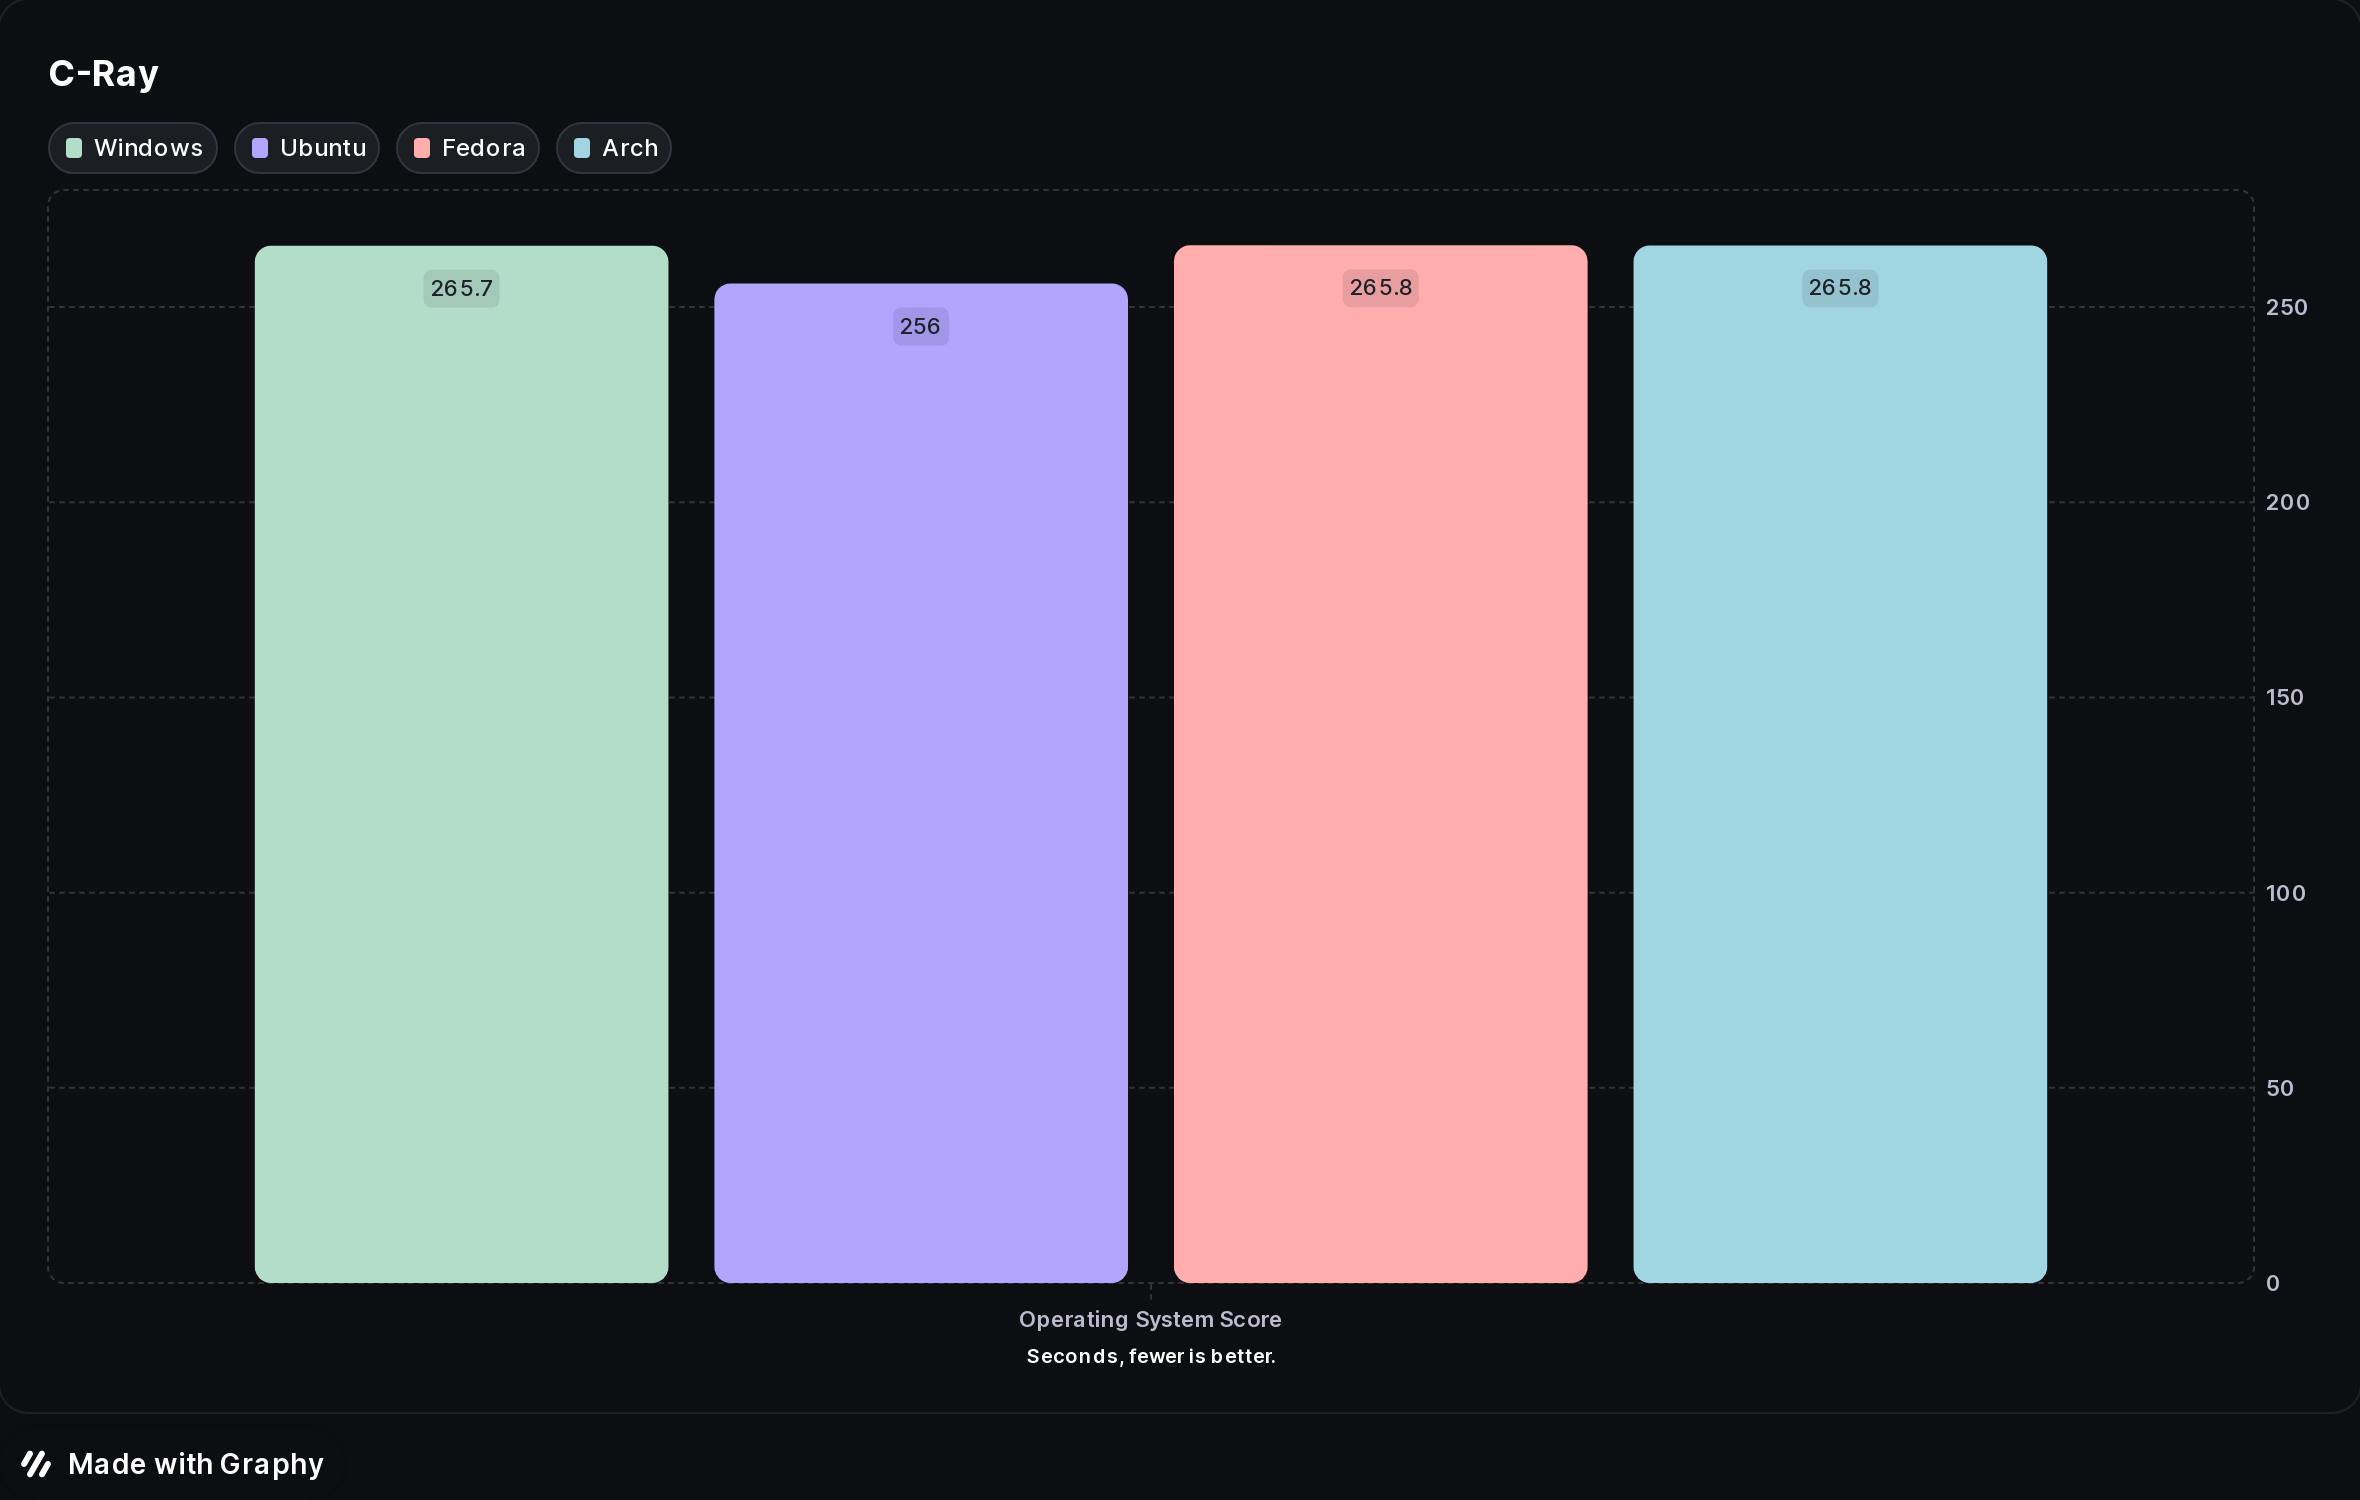
This is a test of C-Ray, a simple raytracer designed to test the floating-point CPU performance. This test is multi-threaded (16 threads per core), will shoot 8 rays per pixel for anti-aliasing, and will generate a 1600 x 1200 image.
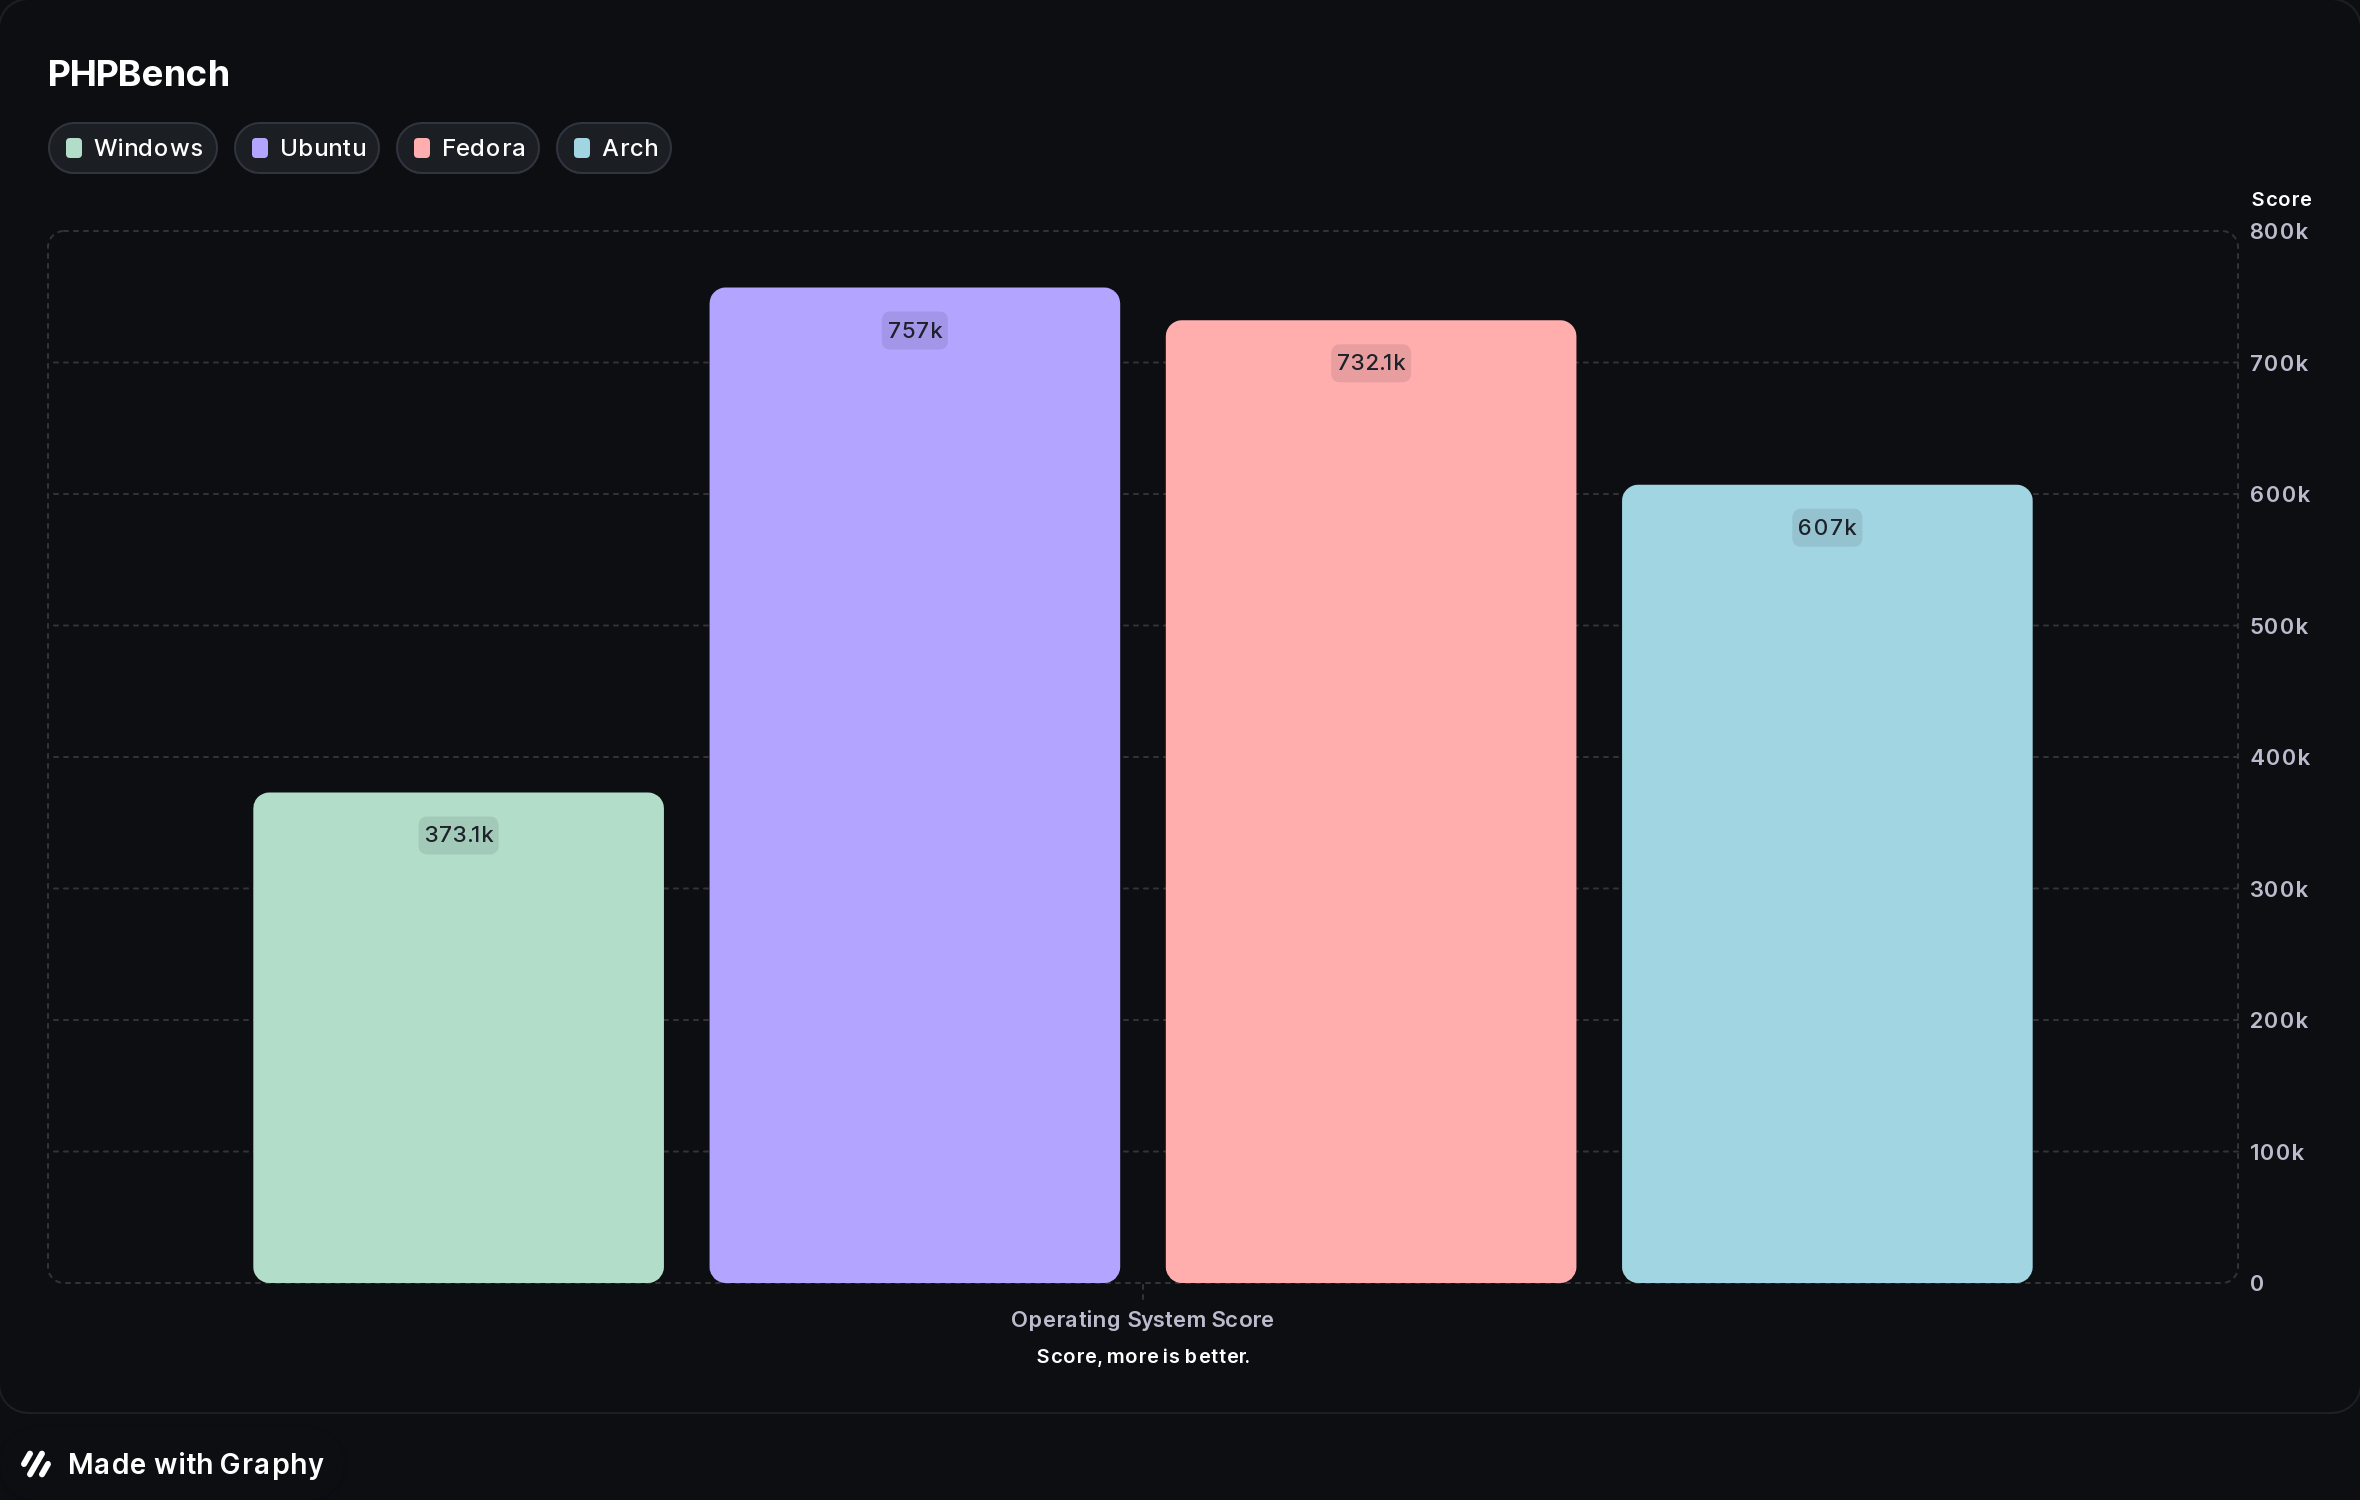
PHPBench is a benchmark suite for PHP. It performs a large number of simple tests to bench various aspects of the PHP interpreter. PHPBench can be used to compare hardware, operating systems, PHP versions, PHP accelerators and caches, compiler options, etc.
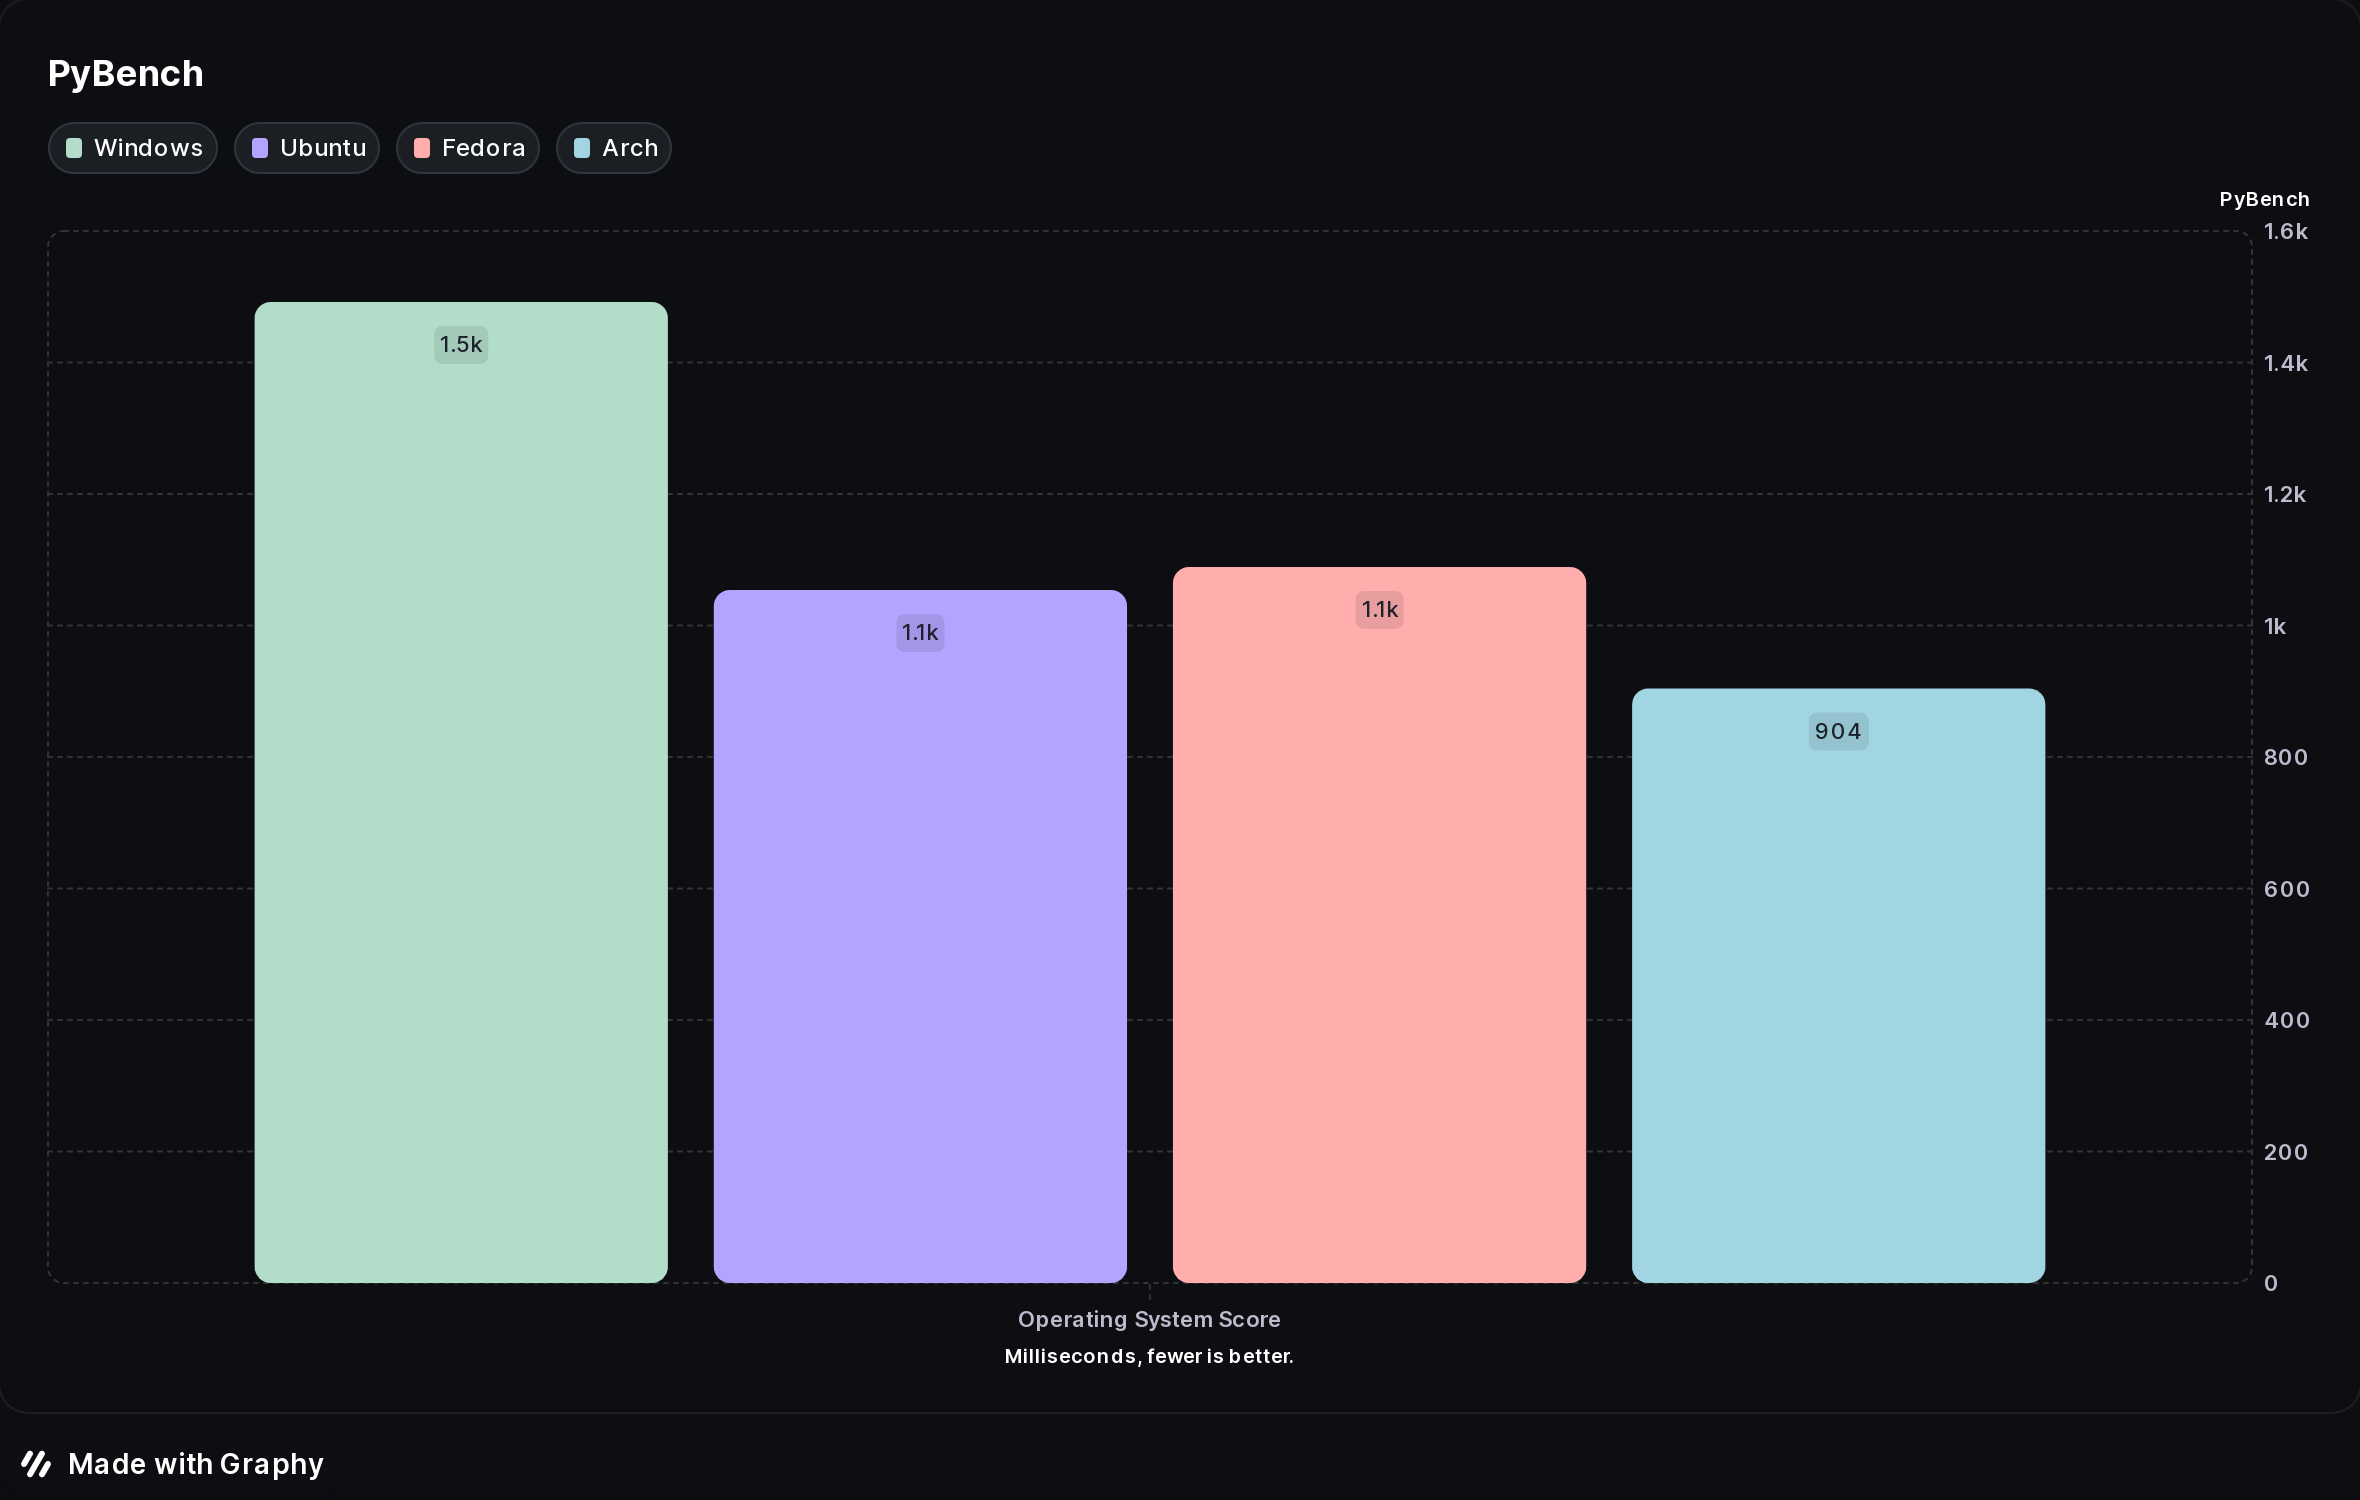
This test profile reports the total time of the different average timed test results from PyBench. PyBench reports average test times for different functions such as BuiltinFunctionCalls and NestedForLoops, with this total result providing a rough estimate as to Python's average performance on a given system. This test profile runs PyBench each time for 20 rounds.
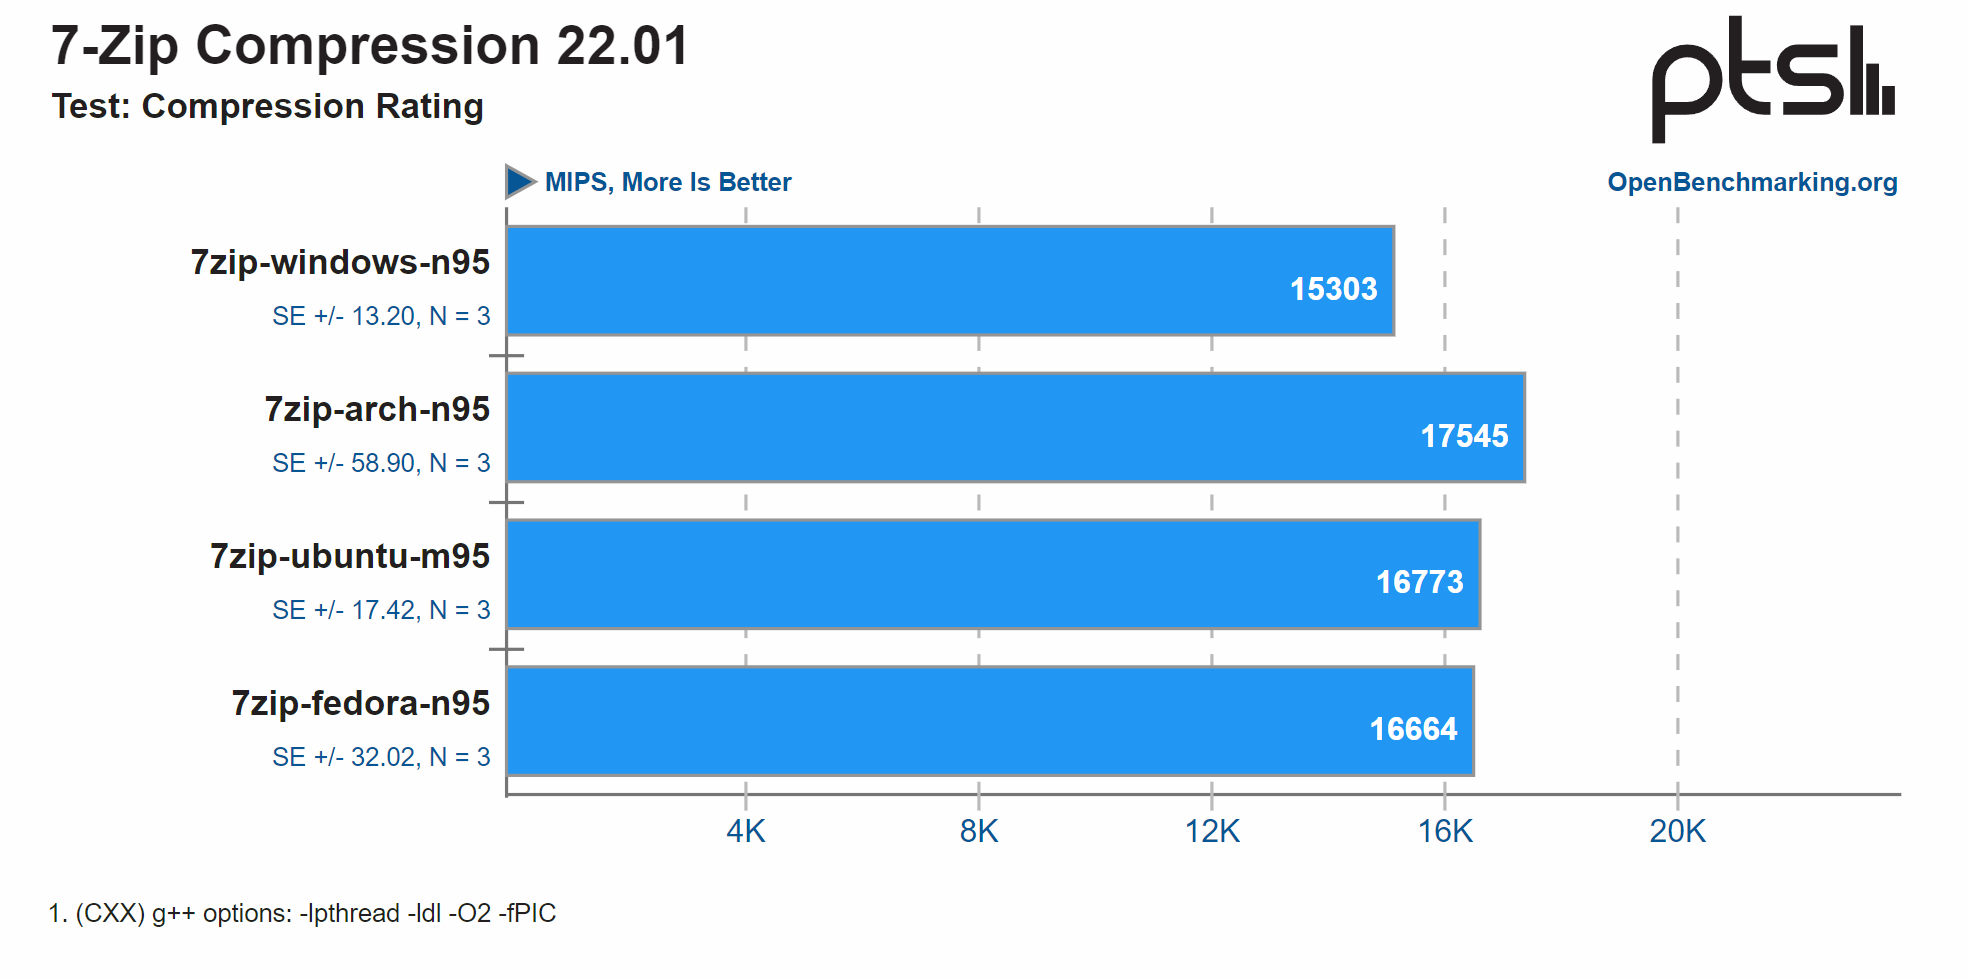
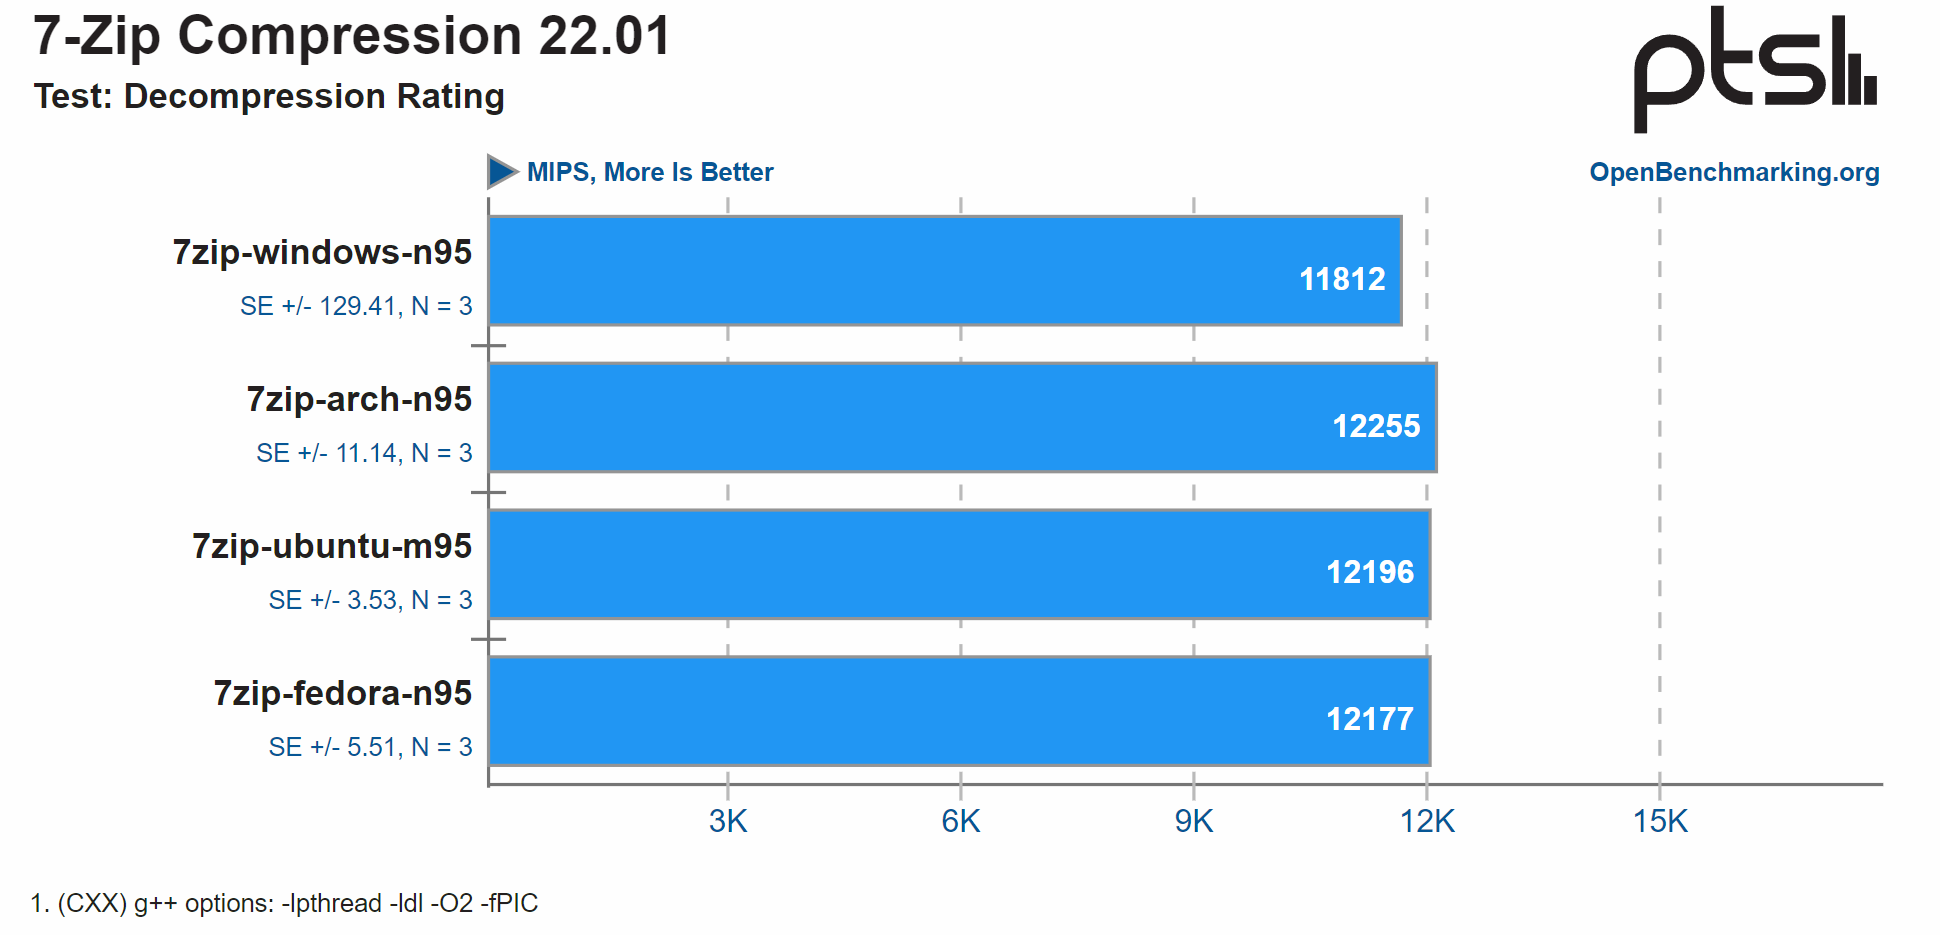
This is a test of 7-Zip compression/decompression with its integrated benchmark feature.
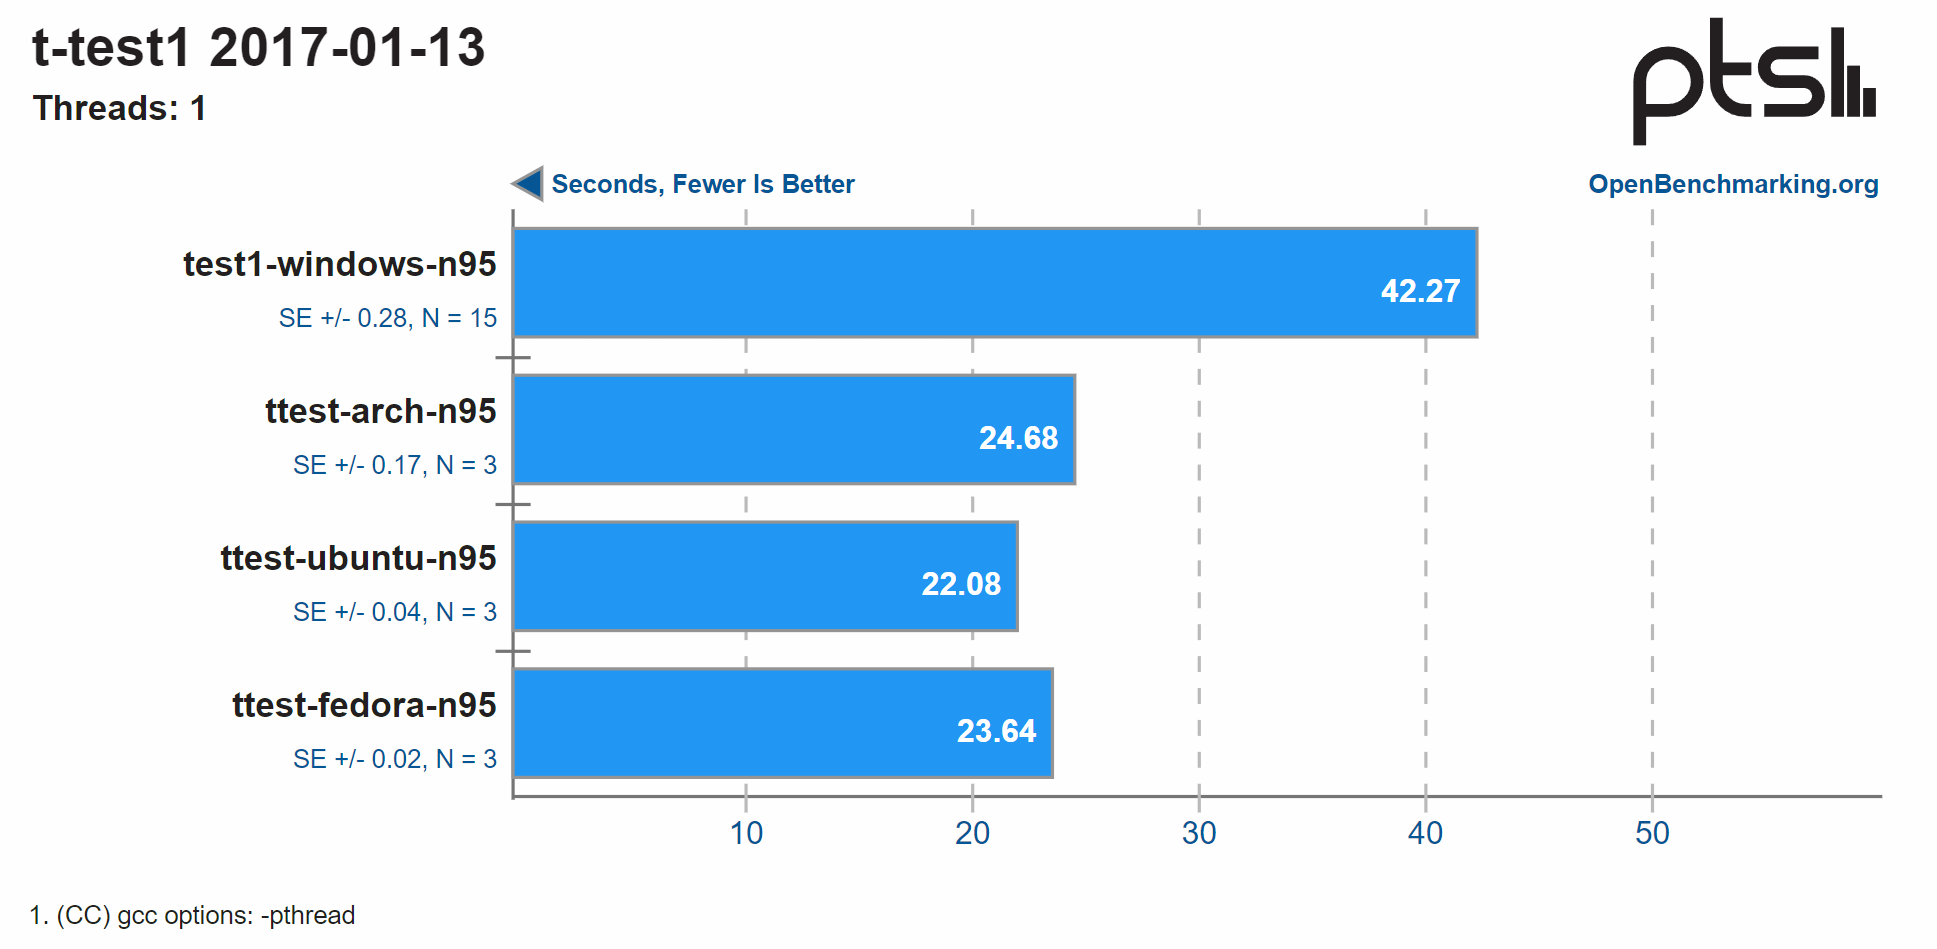
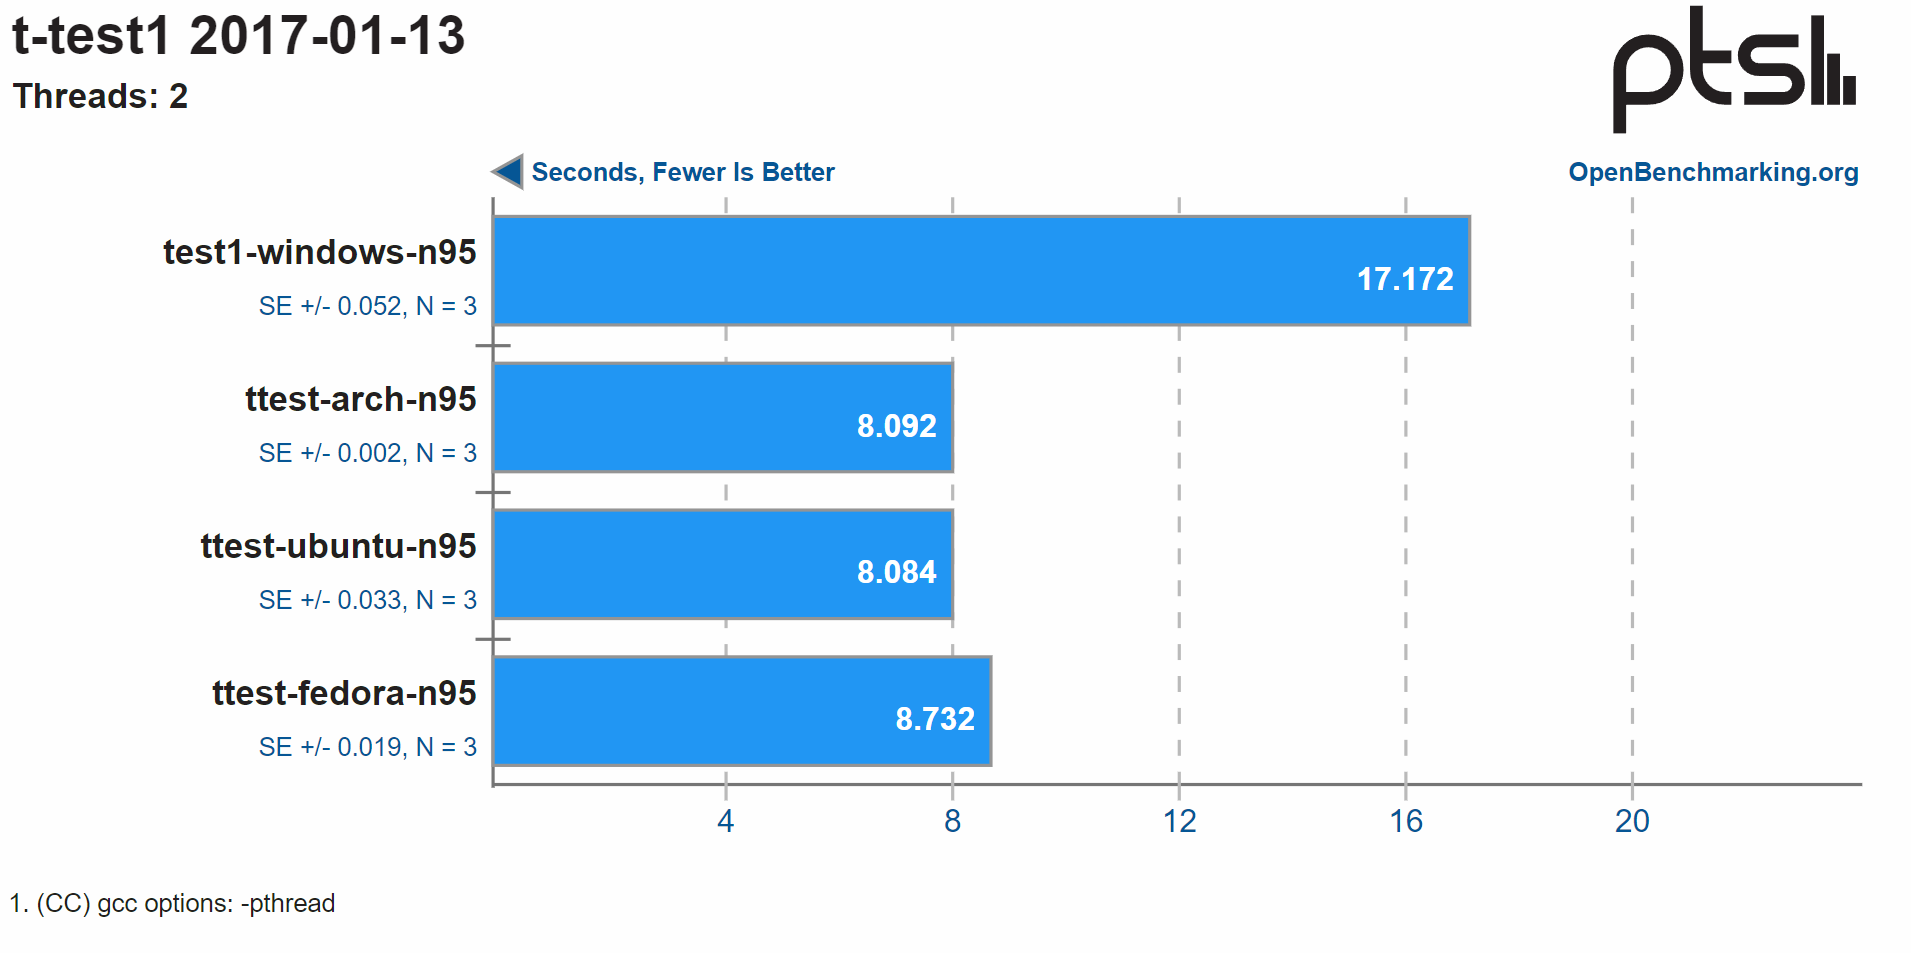
This is a test of t-test1 for basic memory allocator benchmarks. Note this test profile is currently very basic and the overall time does include the warmup time of the custom t-test1 compilation.
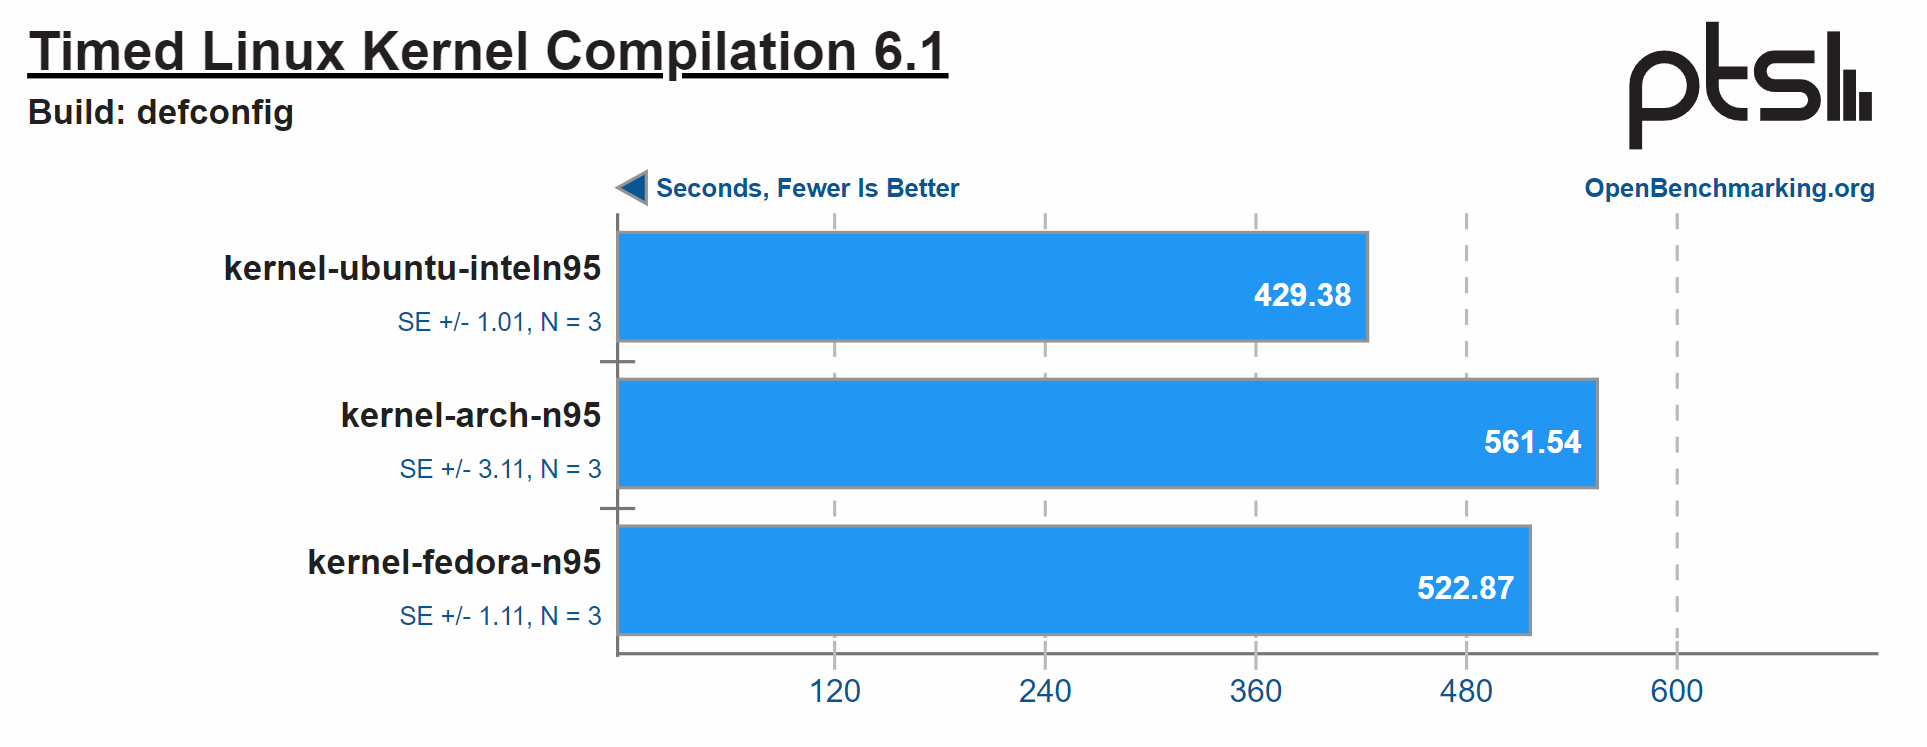
The Timed Linux Kernel Compilation test times how long it takes to build the Linux kernel in a default configuration.
Comments ()